
A new dashboard experience
Product Designer
2017-2019

Summary
At Sumo Logic, I was a design lead on an agile team consisting of engineers, product managers, user researchers, and other designers to working to reimagine our dashboard experience and redefine data visualization for monitoring and troubleshooting cloud applications.
—
“To win in the competitive landscape, we need a dashboard solution that allows users to easily create dashboards and use metadata to organize the data in them.”
From Hack to p0.
I designed a project as part of a hackathon that enables users to add visualizations to the dashboard in one place. Soon after, this hackathon project was added to the product roadmap evolving into the p0 project shown on this page.
“The next time our system crashes I need to be able to rely on Sumo to help me pinpoint the issue.”

Dev Ops Engineer
Dev Ops Engineers are often on-call, and tasked with solving problems with their cloud application. He doesn't have time to use Sumo Logic's query language, and relies more heavily on using pre-existing dashboards as a jumping off point to find the route cause of the issue. He needs to be able to manipulate the view of his dashboard based on his knowledge of his applications.
“I’m an expert as using Sumo Logic. Now I just want to set up an efficient work flow to enable engineers on my team to quickly troubleshoot our apps.”

IT Manager
Personas
The solution
Through generative research I was able to gather insights around how to best streamline an IT manager’s workflow, so that they can more effectively enable Dev Ops Engineers to efficiently monitor and troubleshoot his application.

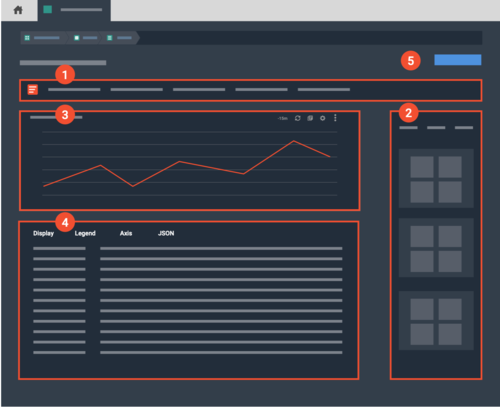
Panel Builder
The chart creation experience was revamped through a new panel creation surface that allowed for a single pane view. This approach provided an easy centralized place for users to select a visualization, attach a query, change the chart settings, and apply the panel to their dashboard.
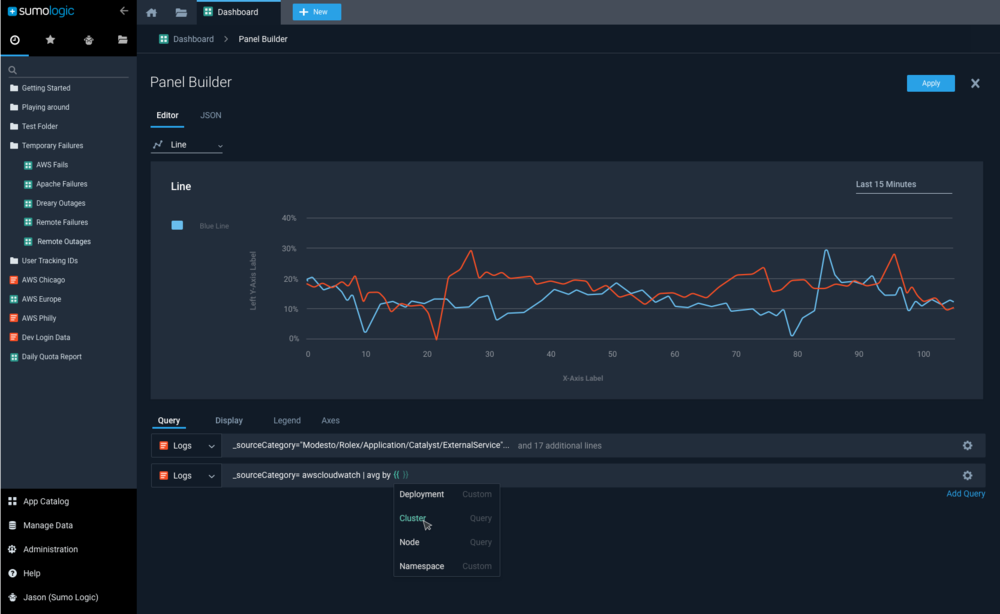

Variable Integration
IT Managers can easily create a variable and populate the queries behind the charts with those variables. Dev Ops Engineers can then select these variables on the dashboard and watch it’s view change depending on the value he selects.

